A few months ago I wrote about marketing budgets and how the fastest-growing firms spend significantly more on marketing than their slower-growing peers. As evidence, I shared this data from the 2026 High Growth Study Executive Summary:
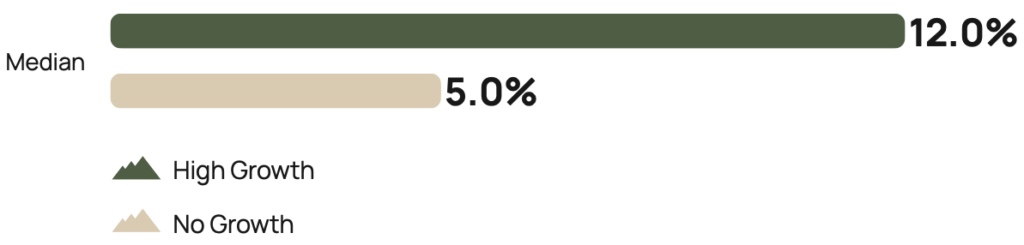
This chart compares the proportion of revenue that high-growth and no-growth firms dedicate to marketing.
In this article, however, I want to dig a little deeper and share some comparative data from the four professional services industries we studied in depth this year:
- Accounting & Financial Services (A&FS)
- Architecture, Engineering & Construction (AEC)
- Consulting
- Technology & Software
While there is a great deal you can learn from the aggregated professional services executive summary, there are many differences between industries. Below is a breakdown by industry of marketing spend as a percentage of revenue, not including staff compensation costs.
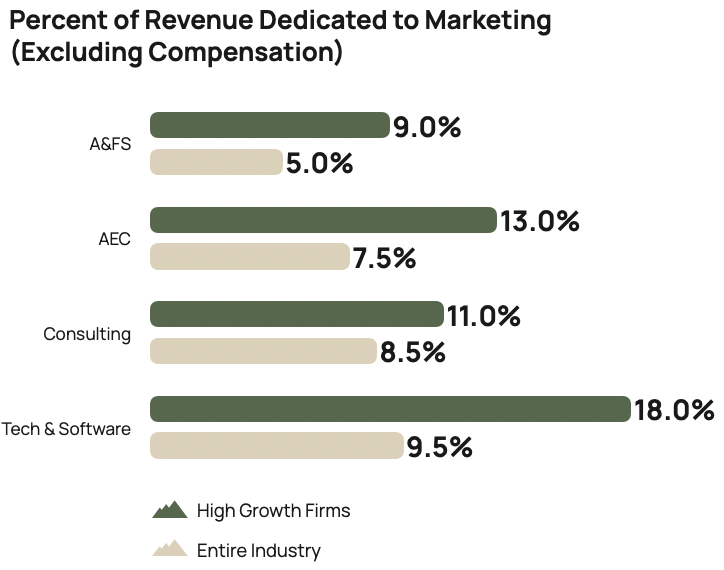
What a different story this data tells than the all-industry chart I shared above!
Before I go further, I have to point out that these two charts compare different cohorts. The baseline in the top chart is “no growth” firms—firms that either did not grow or shrank over a three-year evaluation period. In the second chart, the baseline is high-growth firms—those that grow at a compound annual rate of 20% for three consecutive years.
Why the difference? In our study, we sometimes compare the two extremes (high growth vs no growth) to contrast the behaviors, approaches or results between top performers and low performers. If you would like to compare apples to apples, however, the all-industry median percent of revenue dedicated to marketing is 8%.
Why Marketing Budgets Vary by Industry
Looking at the second chart above, I notice one thing right off the bat. The technology & software industry’s marketing spend runs twice as hot as the accounting & financial services industry’s. That’s true of the high growth cohort as well as the industry as a whole.
There may be a couple of reasons for this. First, and we experience this first hand with our own clients in this vertical, they are more prone to invest in marketing tech earlier and use its most sophisticated features. Of all the industries we studied, technology & software had the highest scores for digital maturity and proficiency in using marketing metrics.
Second, the accounting & financial services sector is among the most conservative when it comes to marketing. Historically, the industry has lagged others in marketing spend. Dive deeper and separate accounting from the rest of financial services, and our research with the Association for Accounting Marketing shows budget spending is significantly more conservative than this. And it gets the highest proportion of its leads from referrals (48%) of any other industry. That’s twice as many as technology & software (24%).
The consulting industry has the least separation between the two categories (high growth vs all professional services)—and is the industry that most closely matches the all-industry numbers. This is because consulting not only represented the largest proportion of the study sample (35.8%), a wide range of subindustries roll up under it, from management consulting to HR to staffing services. It is a broad and diverse world unto itself.
The AEC industry falls somewhere in the middle. The industry as a whole spends the second least on marketing (though well ahead of accounting & financial services). However, its high-growth firms spend the second most on marketing (though well below their tech peers). To me, this says the AEC industry—once an industry not known for trying new things when it comes to marketing (because they didn’t have to—their referral game has always been strong)—is beginning to change and embrace new marketing technologies and perhaps a broader array of techniques.
As I point out in my original article on this topic, new AI-driven technologies may be driving some of the increase in marketing spending at high-growth firms. While these investments can be expensive, the potential payoff is great. As firms learn to use them and as the products mature, they will deliver greater efficiency and deeper insights. Precisely what it takes to outperform the field!
I’ve assembled the data above specifically for you, my dear reader, and made it available for the first time. Use it to benchmark your own firm against your industry as a whole and against the top performers.
Way back in 2008 when we first started studying high-growth firms, they actually spent less on marketing than their slower-growing competitors. They were simply using their budgets more efficiently. Today, that’s not enough. Firms that want to achieve top performance are investing heavily to get there. It’s possible that this dynamic will change in the future, but in the current marketplace it appears to take money—and a smart strategy—to distance yourself from the pack.

Additional Resources
- The 11th edition of Hinge’s annual High Growth Study explores how the fastest-growing professional services firms achieve exceptional growth and profitability—and how ordinary firms can emulate them. Download the Executive Summary for FREE here.