Are you budgeting too much or too little on marketing? A lot has happened over the last year, so do you need to make a change? Fortunately, our 2026 High Growth Study offers a fresh answer.
First, let’s talk about what’s changed. There is, of course, all the stuff you read about in the news: on-and-off-again tariffs, socio/geo/political turbulence, and plenty of uncertainty about regulations and policies that affect a wide swath of professional services industries.
Then there is this:
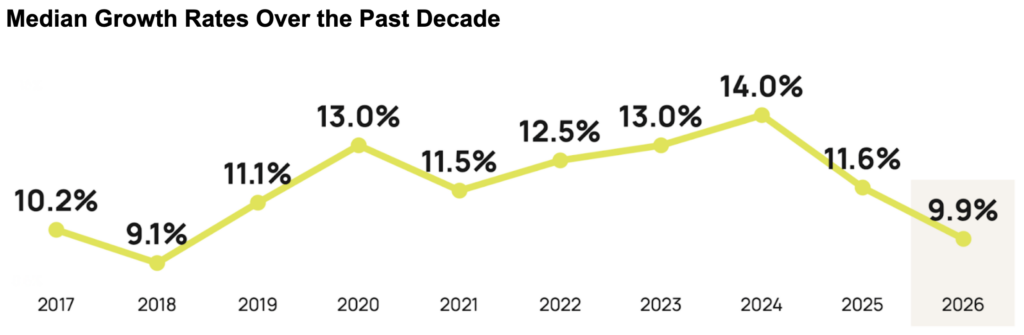
Growth has fallen to the lowest level since 2018, shedding 1.7 percentage points in the last year alone.*
Marketing Spending Trends
How do you think leaders responded when it came to their marketing spend? In fact, across the professional services, spending (not including compensation) notched up one percentage point, from 7% in 2024 and 2025 to 8% in 2026.
So if you are looking for a broad market benchmark, it’s 8%.
But there’s another bit of data you might want to consider. In our study, we compare a group of top performers that we call high-growth firms to their no-growth counterparts. High-growth firms are those whose annual revenues grew 20% or more annually for the past three consecutive years, and no-growth firms are those that grew not all or contracted over that period.
What did these two groups on the outer edges of our sample spend on marketing last year? Here’s the data:
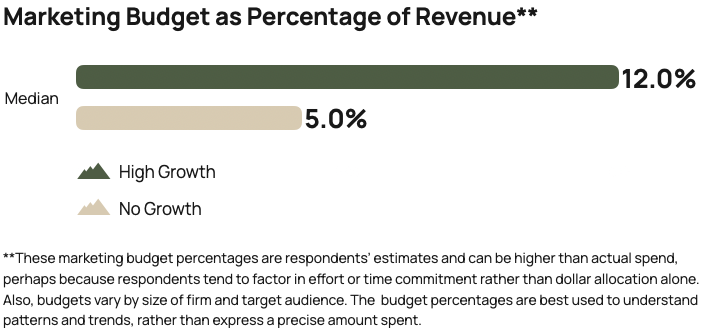
No-growth firms not only spent less (over a third less) than the marketplace as a whole, they kept their marketing budgets exactly where they were the previous year. Like the majority firms, this group’s revenues also declined year over year.
What about the high-growth firms? We pay special attention to this group because their financial performance is spectacular even when the going gets tough. We look to them as models of “how to do marketing right.” And we take note of any changes they make from one year to the next.
This group increased its marketing spend from 10% in the 2025 report to 12% this year—an eye-opening 20% jump.
Why High-Growth Firms Spend More
Why are high-growth firms outinvesting their slower-growing counterparts by anywhere between 50% and 240%? We don’t have hard data to answer this question, but we have four theories based on what we’ve experienced with our clients.
First, we know that some firm leaders think of marketing as a cost center rather than a growth engine. This might explain why no-growth firms kept their marketing budget at the same low level. On the other hand, many of these underperformers—the median no-growth firm took a 12.2% loss—simply may not have any additional money to allocate to marketing.
Second, high-growth organizations may recognize an opportunity when they see it. When the market is down is when growth potential is the greatest. So they poured more into marketing knowing that others were being more cautious. They were rewarded with a 39.9% median growth rate, 4.7 times higher than average!
Third, a lot of high-growth firms are investing heavily in artificial intelligence, including AI-powered marketing tech. This doesn’t come cheap, and because the technology is new, some firms are experimenting with multiple competing platforms to determine the best fit.
Fourth, marketing is the smartest path to establish and sustain visibility. Recently, I covered the five marketing techniques that deliver the biggest impact for high growth firms. These tactics are aimed squarely at building visibility and credibility. Even those firms that heavily rely on referrals to drive new business understand that any serious buyer, no matter how strong the referral might be, will want to validate the recommendation by reviewing the firm’s website, LinkedIn profiles, and thought leadership pieces. These are all facets of marketing.
With all of this information in mind, it may be time to take a fresh look at your marketing budget. While there are no one-size fits all answers to the question, “Am I spending too much or too little?” you are now equipped with the context to make a better decision.
*Dates refer to the year the data was published, not when it was collected. Each year’s data was captured in the prior year. For instance, data labeled 2025 reflects the marketplace in 2024.