How much should you spend on marketing? It’s a good question, and one we hear often. Spend too little, and your revenue is likely to suffer. Spend too much and you risk wasting money that could have been better invested in other important areas.
Of course, figuring out where that line between too little and too much lies is as much an art as a science. But let’s indulge in a little science as a starting point.
Here’s what the data from the 2025 High Growth Study says.
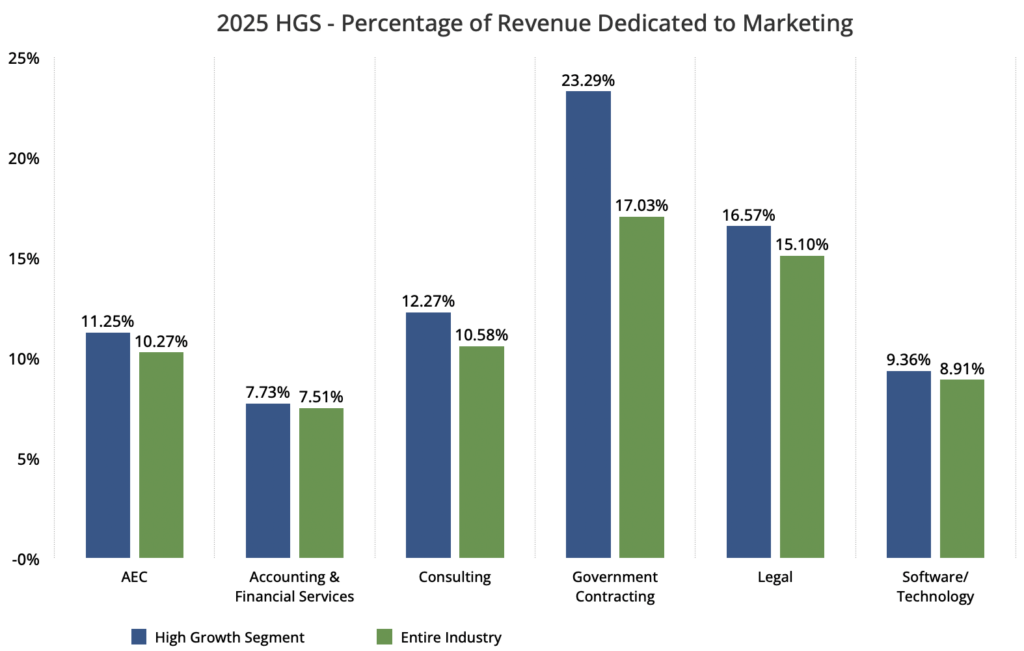
Note that we’ve compiled data from each of the core professional services industry segments. And within each industry, we’ve included metrics for two groups: 1) the entire industry sample (green); and 2) the High Growth cohort (blue)—those firms that grew at least 20% for three consecutive years.
How to Read This Chart
This chart not only provides a benchmark for your industry overall, it also shows what the best performers are investing in marketing. This data alone goes a long way toward answering your question. But wait! There’s more to the story.
One thing you can’t help but notice is that the percentage varies significantly from industry to industry. Why is that?
The data itself doesn’t have much to say on that front. But we can tell you from our experience working with firms in all of these industries that a wide range of factors contribute to these differences. For instance, in the AEC industry, pass-through costs (materials, equipment, contract labor, etc.) often make up a high proportion of their revenue, potentially artificially depressing their marketing budget numbers. Firms in the accounting industry (distinct from financial services) often spend less on marketing because they have a high percentage of repeat business from year to year. Other industries, such as government contracting, report a higher spend on marketing as a means of combating the intensely competitive bid for both government work and teaming arrangements. And of course there are firms across every corner of professional services that can see themselves in these “unique” circumstances.
Now, something you can’t see from this chart is how these numbers move from year to year. There can be a lot of variability. Over time we see different industries grabbing the top spender spot and others sinking like pebbles to the bottom. This churn can be attributed to a variety of factors, such as market cycles, changing industry norms, technical advances, labor market conditions and more.
But just because the numbers change over time, however, doesn’t mean they aren’t useful. This is the closest you can get to knowing how much your competitors are investing in marketing today. And that intel can be very useful as you plan next year’s marketing strategy and budget.
Another thing you may notice about this year’s data is that High Growth firms spend more than their slower-growing counterparts. What can you learn from them?
Firms that consistently generate outstanding revenues and profits clearly know something about marketing and business development. For one thing, they have a better idea than most firms what marketing strategies, tools and techniques tend to work in their industry. How do they know? In most cases, they learned from researching the learning and buying behavior of their target audiences, and then matched their marketing to that behavior. And,unlike much of their competition, they track from their successes and failures. Some even run marketing experiments. In short, they treat marketing like a science.
High Growth firms also seek out efficiencies. In our research, we’ve found that High Growth organizations are more likely to have completed a digital transformation and are more advanced users of technology than their competitors. Marketing automation, in particular, can dramatically decrease labor costs while increasing audience engagement. And AI, while still in its infancy today, promises even greater performance improvements—especially to those who embrace it early.
How to Set Your Marketing Budget
How big should your marketing budget be? Start by looking at your current budget. How does it compare to your overall industry (the green bar) in the chart above? This will give you a general sense of whether you are over or under investing relative to your peers.
Next, compare your budget to the High Growth cohort. Think of this as the ideal budget for your industry. Are you spending more or less?
Remember when we said finding your ideal marketing budget was as much an art as a science? Well, we’ve covered the science. Now it’s time to flip on our right brain switch and engage in a little art.
It’s easy to assume that the High Growth firms’ marketing budget should be your guide. After all, they have figured out the optimal marketing spending level, right? That’s true. But….
High Growth firms spend what’s required to run their highly optimized marketing programs. Likely, your configuration is different. Our High Growth Study show you what these firms do, and we encourage you to check out the report for your industry. Even if you aren’t ready to purchase an industry report, you can read some of the top highlights on our blog.
Most likely, you should be spending an amount relatively close to your industry benchmark. Begin there, then use what you have learned about High Growth firms—and your best judgment (art!)—to determine if your marketing program is more sophisticated than average. If so, calibrate your marketing budget a bit closer to the High Growth level. Over time, as you implement more of the strategies used by your industry’s top performers, you can adjust your budget accordingly.
As you plan for next year, we hope this helps.